


Article Figures & Data
Figures
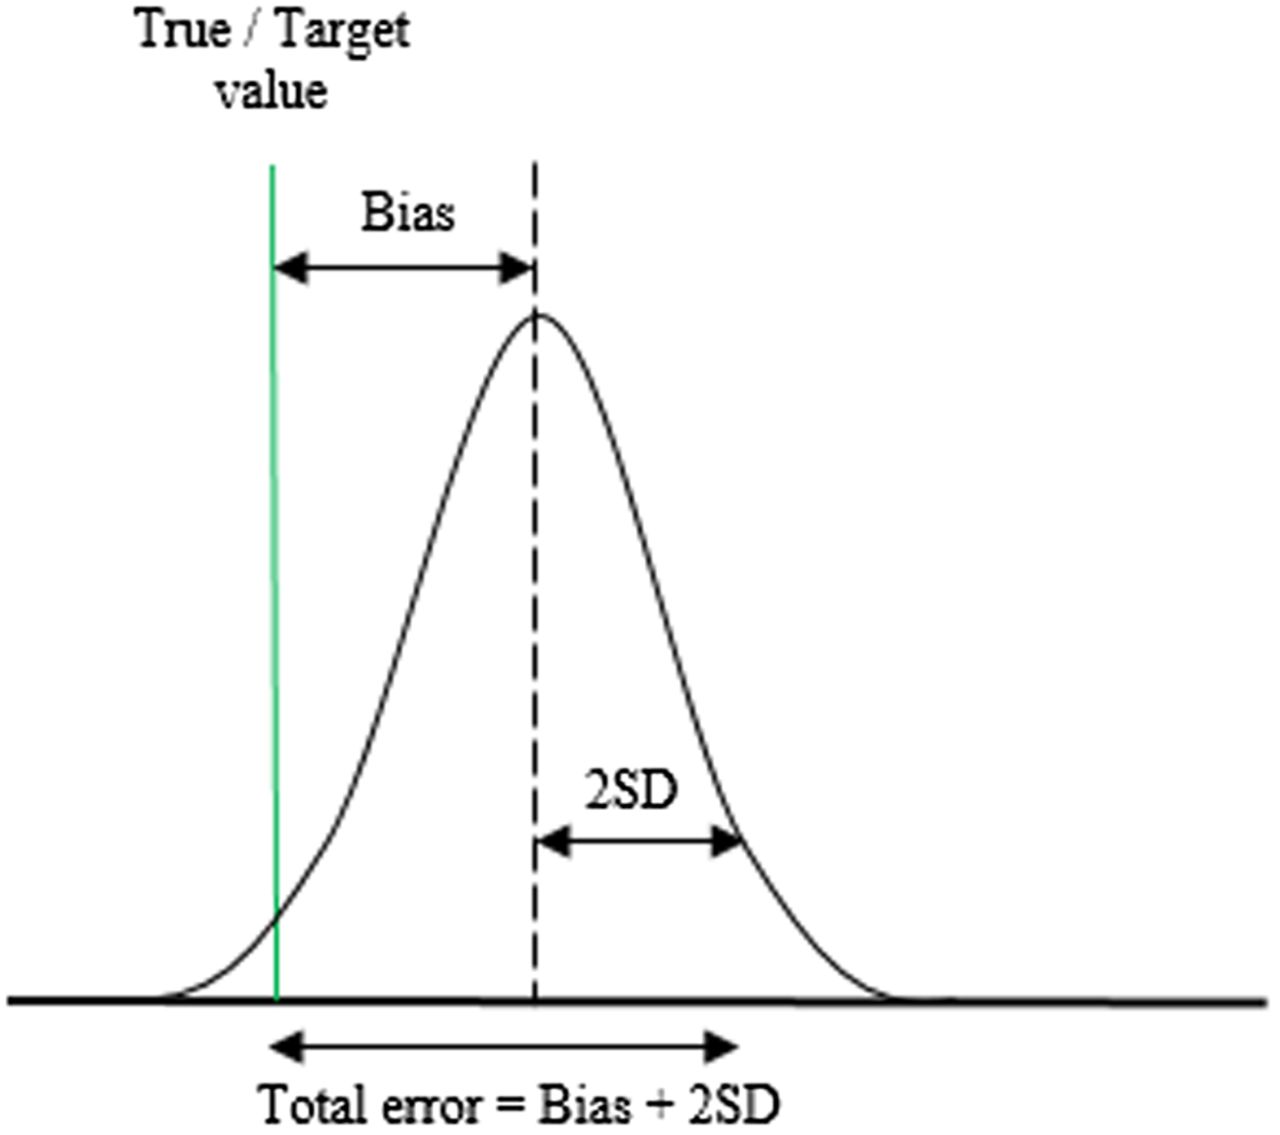
- Figure 1.
Illustration of the concept of total error, which is the combination of systematic error (bias) and random error (2 SD).
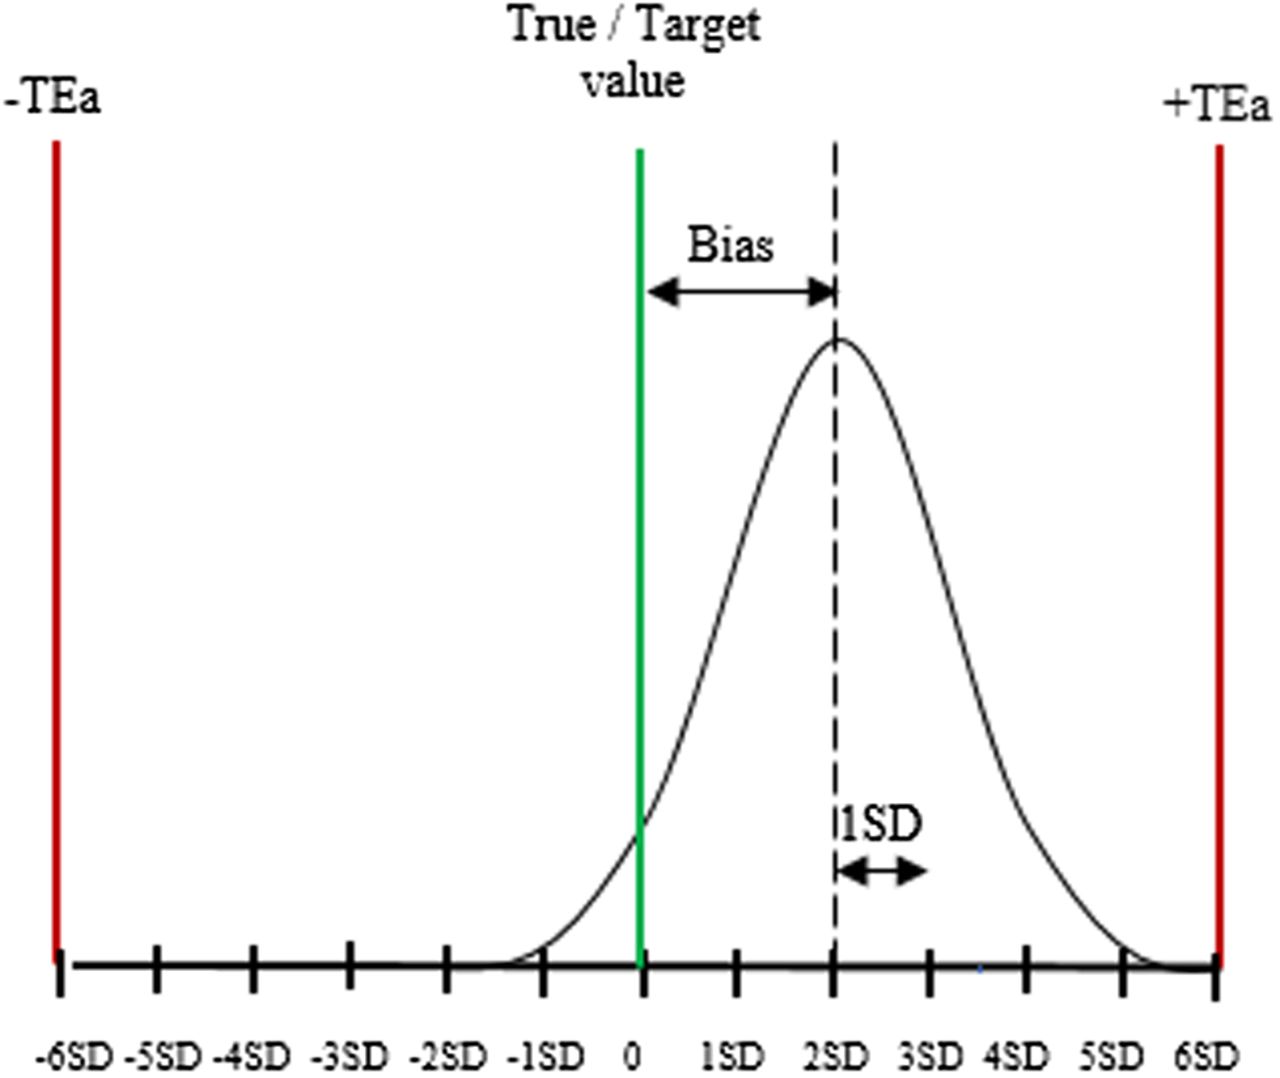
- Figure 2.
Sigma metric. The graph shows how six-sigma tolerance limits apply to QC in a clinical laboratory. The sigma value of this essay is four, as the mean is at 4 SD from the upper tolerance limit.


Tables
Sigma QC Rules Number of Runs ≥6 13s 1 5 13s/22s/R4s 1 4 13s/22s/R4s/41s 2 <4 13s/22s/R4s/41s/8x 4


Jump to section
Related Articles
Cited By...
- No citing articles found.
More in this TOC Section
Similar Articles
Keywords
- ΔSEc - critical systematic error
- CAP - College of American Pathologists
- CLIA - Clinical Laboratory Improvement Amendments
- DPM - defects per million
- EQA - external quality assurance
- IQC - internal quality control
- PT - proficiency testing
- QC - quality control
- RCPA - Royal College of Pathologists of Australasia
- SD - standard deviation
- TE - total error
- TEa - total error allowable
- performance standards
- quality goals
- evidence-based quality control
- critical systematic error