


This article requires a subscription to view the full text. If you have a subscription you may use the login form below to view the article. Access to this article can also be purchased.
- Address for Correspondence: Shashi Mehta
, SHP-Rutgers University, mehtas1{at}shp.rutgers.edu
LEARNING OBJECTIVES
1. Define method validation.
2. Elucidate the eight steps involved in a method validation.
3. Explain how statistics is applied to validate a new method.
ABSTRACT
Method validation is utilized to confirm that a test procedure for an analyte yields accurate and precise results. In this article, hemoglobin A1C is used as an example to demonstrate the process of a method validation; the performance of the Siemens Dimension Vista 1500 (new method) was compared with the Integra 800 Roche Modular System (old method). There are eight essential components for method validation: stating the primary objectives, listing the known variables, applying statistics, clarifying the analyte involved, selecting samples, explaining the methods used, performing data analysis, and explaining the results. These steps are critical for an analytical method validation procedure and are required in order to use a new assay for the clinical diagnosis of a patient.
- CAP - College of American Pathologists
- CLIA - Clinical Laboratory Improvement Amendments
- CV - coefficient of variation
- HbA1C - hemoglobin A1C
- SD - standard deviation
- SE - systematic error
- SEa - allowable systematic error
- RE - random error
- TEa - total allowable error
INTRODUCTION
Method validation is the process used to confirm the accuracy and precision of a given analytical method or instrument. The true value of a patient-derived analyte depends on the method performance, and the results obtained from a new method must be better (eg, more reliable, more consistent, a better turnaround time, improved sensitivity and/or specificity) or, at minimum, comparable to the original method. Hemoglobin A1C (HbA1C) is used to illustrate an example of a method comparison (validation) in this article and eight steps demonstrate the process, described in the following.
STATEMENT OF PRIMARY LABORATORY TEST OBJECTIVES
Method validation is performed when a lab acquires a new instrument and is testing a new procedure; it is used for assessing whether a new instrument is reporting valid results. Using statistics to determine accuracy, a method validation can establish the instrument performance compared with a gold standard method. Analyzing quality control samples helps determine the instrument precision by calculating the mean, standard deviation (SD), and coefficient of variation (CV). Activities that can be involved in method validation studies include calibrations for various analytes and confirming the linearity of the method throughout the measurable range. The performance of method validation studies are mandated by Clinical Laboratory Improvement Amendments (CLIA), the College of American Pathologists (CAP), and the Joint Commission for any new method.
IDENTIFY THE KNOWN VARIABLES
The known variables are categorized as independent and dependent. They refer to characteristics of the patient sample. Independent variables include the substances in a sample, such as lipemia, hemolysis, and icterus, that can lead to erroneous results. Independent variables do not include the amount of the specimen. The dependent variable is the concentration of the analyte that will be used to determine a reference range.
APPLY APPROPRIATE STATISTICS
Statistical data such as the CV, SD, mean, random error (RE), and systematic error (SE) are used to determine the method precision, accuracy, and total allowable error (TEa). The mean is calculated to obtain an average value for all the test results, the SD is a measure of the spread of the test results, and the CV is used to compare the mean value to the standard deviation and measure the dispersion of the test results. The TEa of the new test method includes both RE and SE. Random error is the error that occurs as a result of chance, and SE follows a predictable pattern. The difference in test results between a new method and an old method should be less than or equivalent to the TEa. Regression analysis is used to compare two variables to determine if a linear relationship exists. The two variables consist of an independent variable (X) and a dependent variable (Y). Linear regression statistics are used to determine the quality of the relation between the two variables. Test results for the new test method are dependent on the test results of the old test method. All of the data must lie close to and on the straight line.
CLARIFY THE ANALYTE OF INTEREST AND METHOD SELECTION
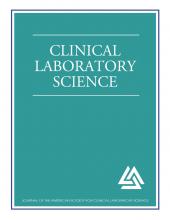
The analyte under investigation should be mentioned in this section of the study. The analyte used for this method validation is HbA1C. It is used to measure glycemic control over a period of three months. A description of the methodology used in the demonstration of this validation study is provided in Figures 1 and 2.

HbA1C data for the test method (Y) and the comparison method (X) (N = 40).

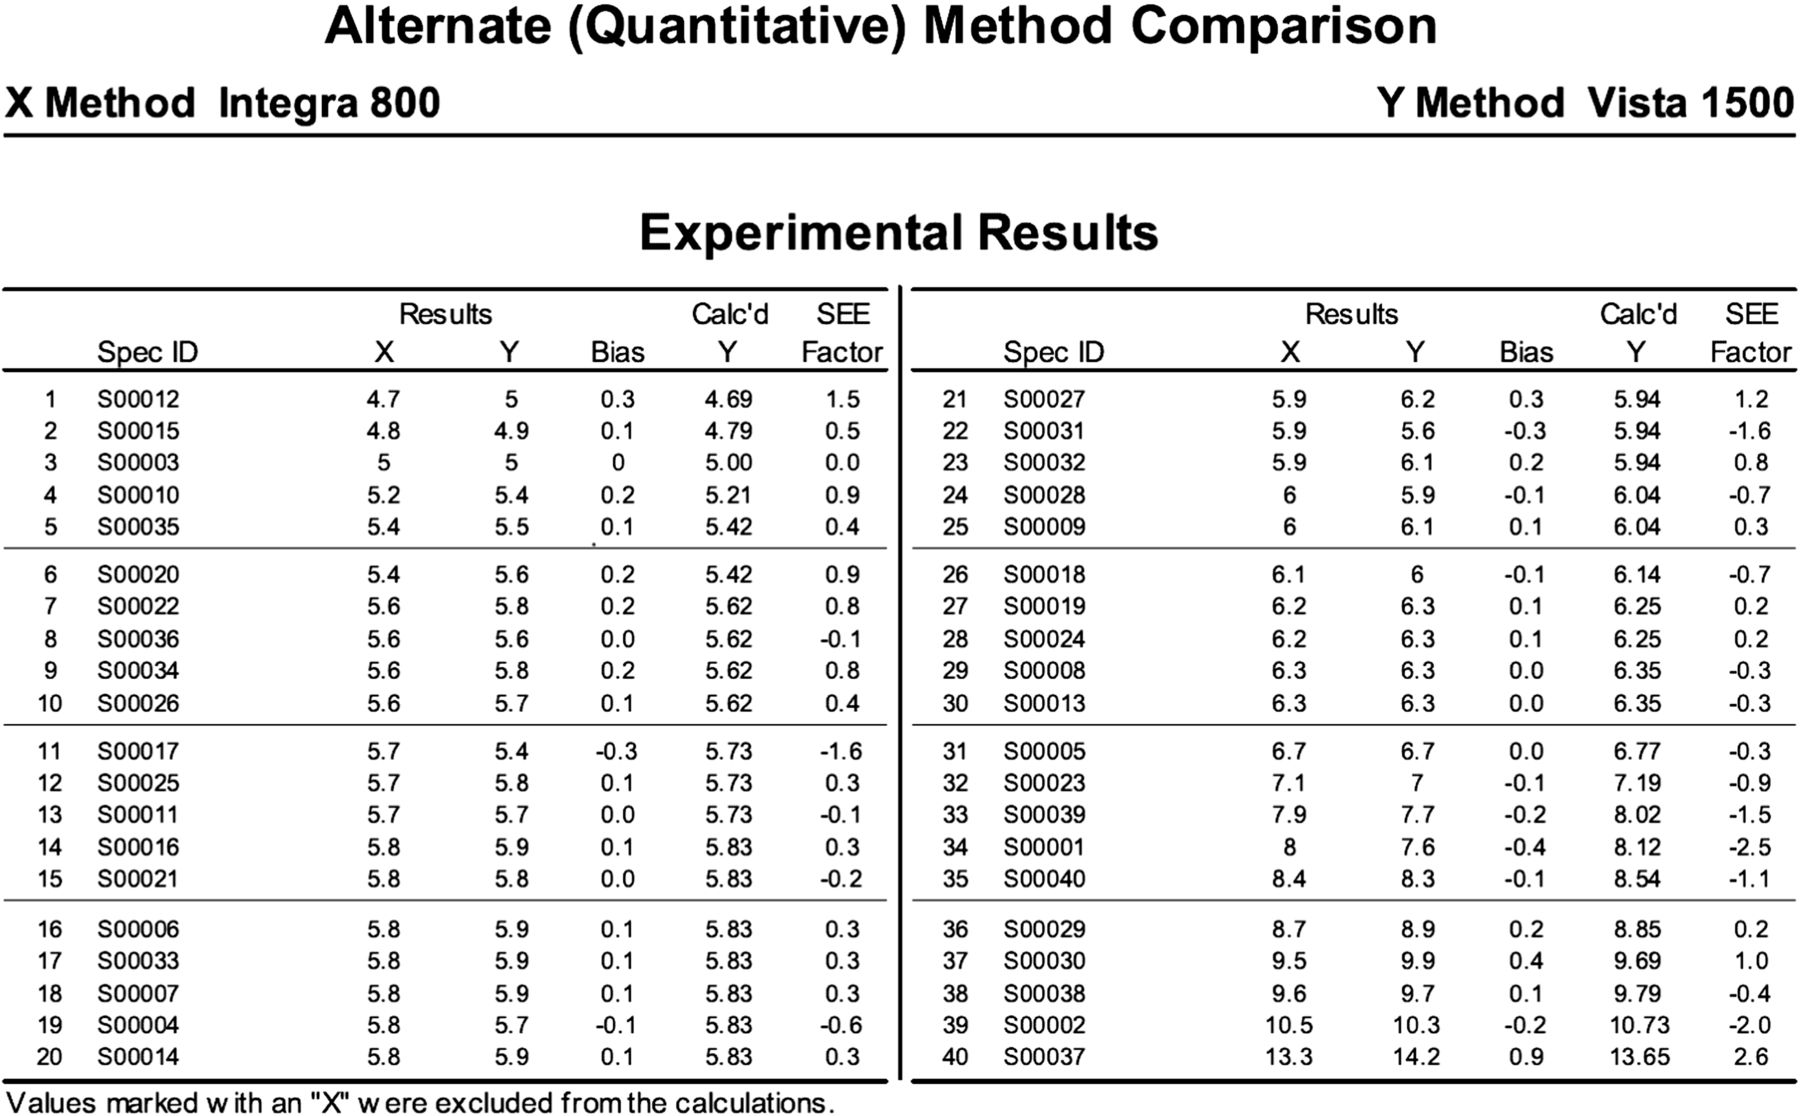
Summary of the data statistics and a brief description of the hemoglobin A1C method comparison.
SAMPLE SELECTION
The quality of the results of the validation study is dependent on the number of data points collected and the range of the data compared with the measurable range. An ideal number of data points/samples is 40, although some laboratories opt to use 20 data points/samples. The samples are chosen at random and should be representative of the normal and abnormal population. The samples should cover the analytical measurement range of the test method. The method validation described in this article used 40 unidentified patient samples at the high, normal, and low concentration ranges of the reference interval for HbA1C.
DESCRIBE THE METHODS
HbA1C samples were run at the Y hospital laboratory on the Siemens Dimension Vista 1500, which is the project site, and at the X reference laboratory on the Cobas Integra Roche Modular 800. Both of these analyzers have different reference ranges for HbA1C because of the difference in methodologies. The Vista 1500 uses an immunoturbidimetric assay, whereas the Cobas Integra 800 operates on a spectrophotometric immunoassay. The manufacturer established reference range for HbA1C on the Vista 1500 is 4.2–6.3%, whereas it is 4.0–5.6% on the Cobas Integra 800. Patients with HbA1C values from 5.6 to 7.4 are considered high-risk patients. Patients who have diabetes have an HbA1C of greater than or equal to 6.5%. Each method for the HbA1C method validation study was analyzed for clinical performance characteristics such as sensitivity, specificity, accuracy, precision, reportable range, and performance standards.
PERFORMING DATA ANALYSIS
The test result values (data) obtained from the Y hospital laboratory and the X reference laboratory are plotted on graphs and observed for any outliers. The mean, SD, and CV are calculated to determine the precision of the method. The data collected from both methods are plotted on a graph; the y-axis represents data from the new method, and the x-axis represents data from the old method. The best-fit line is drawn, and the slope and y-intercept are calculated. The slope is the line of best fit, and the y-intercept is the value at which the line crosses the y-axis. The correlation coefficient is calculated to determine the relationship between the data. Statistical analysis software can be used to graph the data, calculate the slope and intercept, and determine the correlation coefficient.
The performance of the method is determined by calculating the TEa, which consists of both the SE and the RE. The TEa is the amount of error that is clinically acceptable.
EXPLAINING THE RESULTS
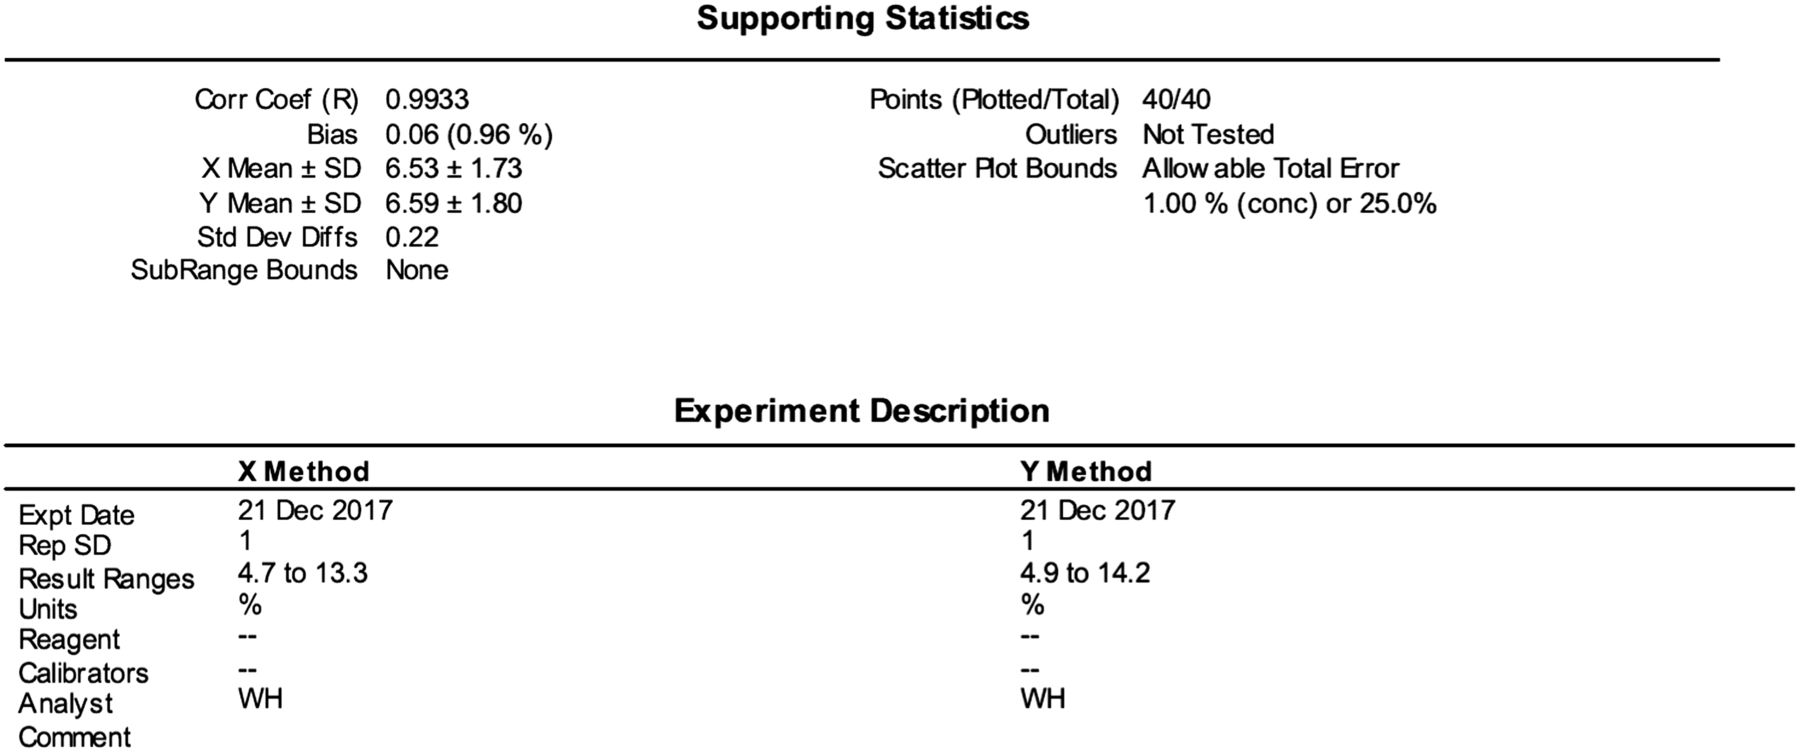
Figures 1 and 2 show the original raw data and the statistical analyses results obtained from a correlation study. Regression analysis is used to compare two variables to determine if a linear relationship exists. The two variables consist of an independent variable (X) and a dependent variable (Y; described previously). Test results for the new test method are dependent on the test results of the old test method. All of the data must lie close to and on a straight line.8 The Deming regression may be used since it is a model that finds the line of best fit for a two-dimensional data set (X and Y variables). It differs from simple linear regression because it accounts for observation errors on both the x- and the y-axes. For a new method to be validated, it must demonstrate a statistical relationship to the method currently in use. The methods can be considered statistically identical if either the slope is 1.00 (within 95% confidence) or the intercept is 0.00 (within 95% confidence) (Figure 3).

Hemoglobin A1C analyzed by the X hospital lab and Y hospital lab method. The scatterplot indicates the Deming regression relationship between X and Y methods. This approach assumes that both the X and Y methods are subject to measurement error, which is different from linear regression, which considers that the two methods have no random measurement errors. The bias plot is a scatterplot with X on the x-axis, and Y-X on the y-axis. The ideal bias plot would have all points falling exactly on the zero line.
The results show a slope of m = 1.042 and an intercept of −0.21, both values within the 95% confidence interval, indicating that the two methods are statistically identical. The TEa of 1 unit or 25% was used to determine if the method performance meets the acceptable standard error rate. The difference between the two methods was within the allowable error for 40 of 40 specimens (100%).
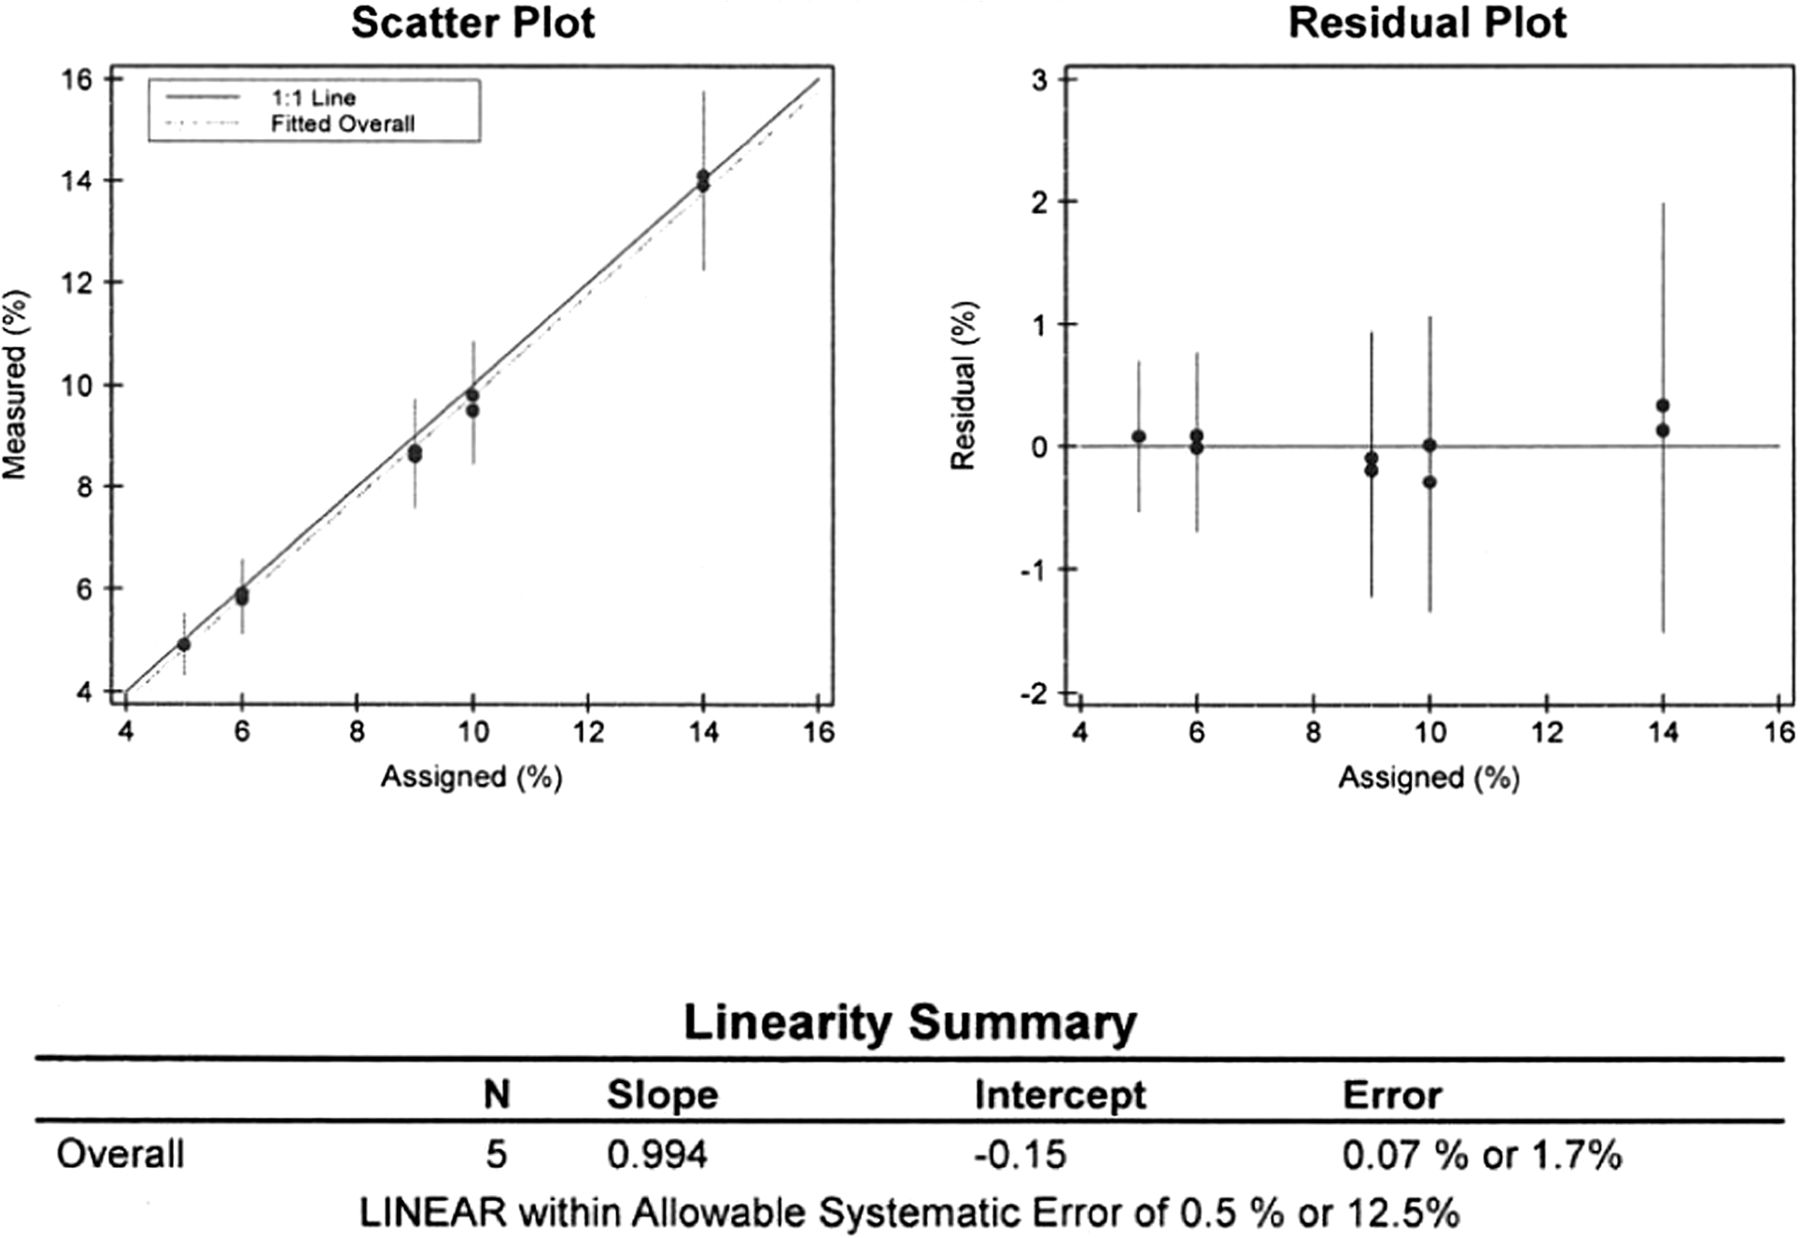
A serial dilution was performed to determine the linearity of the method throughout the reportable range. Six data points were collected for HbA1C by serial dilution, starting at a concentration of 14% and diluting the sample to concentrations of 10%, 9%, 6%, and 5%. The linearity module of the EP Evaluator program was used to verify the instrument reportable range (Figure 4). The method was proven linear throughout the reportable range.

The linearity of HbA1C, which was analyzed on the chemistry Vista instrument. The scatterplot indicates the best-fit line. The residual plot indicates the difference between the best-fit line and either an individual result or a mean measured value.
The linearity of HbA1C was analyzed on the Vista over a measurement range of 4.90% to 14.00%. Allowable systematic error (SEa) was 0.5% or 12.5%. The SE is the amount of bias between the results of the new test method and the comparison method. All the measured concentrations lie close to the mean and assigned values and are linear.
SUMMARY
The eight steps used to validate a method help the laboratory ensure that a new test meets regulatory requirements. The example of the HbA1c study demonstrates an excellent correlation between the new and the old methods. The study, however, did not include enough data points at the lower and higher reportable range. More samples must be included to validate the performance of the instruments at the lower and upper limits of the reportable range.
- Received April 1, 2018.
- Accepted April 5, 2018.
American Society for Clinical Laboratory Science
References
- 1.
- 2.
- 3.
- 4.
- 5.
- 6.
- 7.
- 8.↵
- 9.
- 10.
- 11.
- 12.
- 13.
- 14.
- 15.
- 16.
- 17.
- 18.
- 19.
- 20.
- 21.
- 22.
- 23.
- 24.


Jump to section
Related Articles
Cited By...
- No citing articles found.
More in this TOC Section
Similar Articles
Keywords
- CAP - College of American Pathologists
- CLIA - Clinical Laboratory Improvement Amendments
- CV - coefficient of variation
- HbA1c - hemoglobin A1c
- SD - standard deviation
- SE - systematic error
- SEa - allowable systematic error
- RE - random error
- TEa - total allowable error
- method validation
- precision
- accuracy
- linearity
- correlation