


Article Figures & Data
Figures
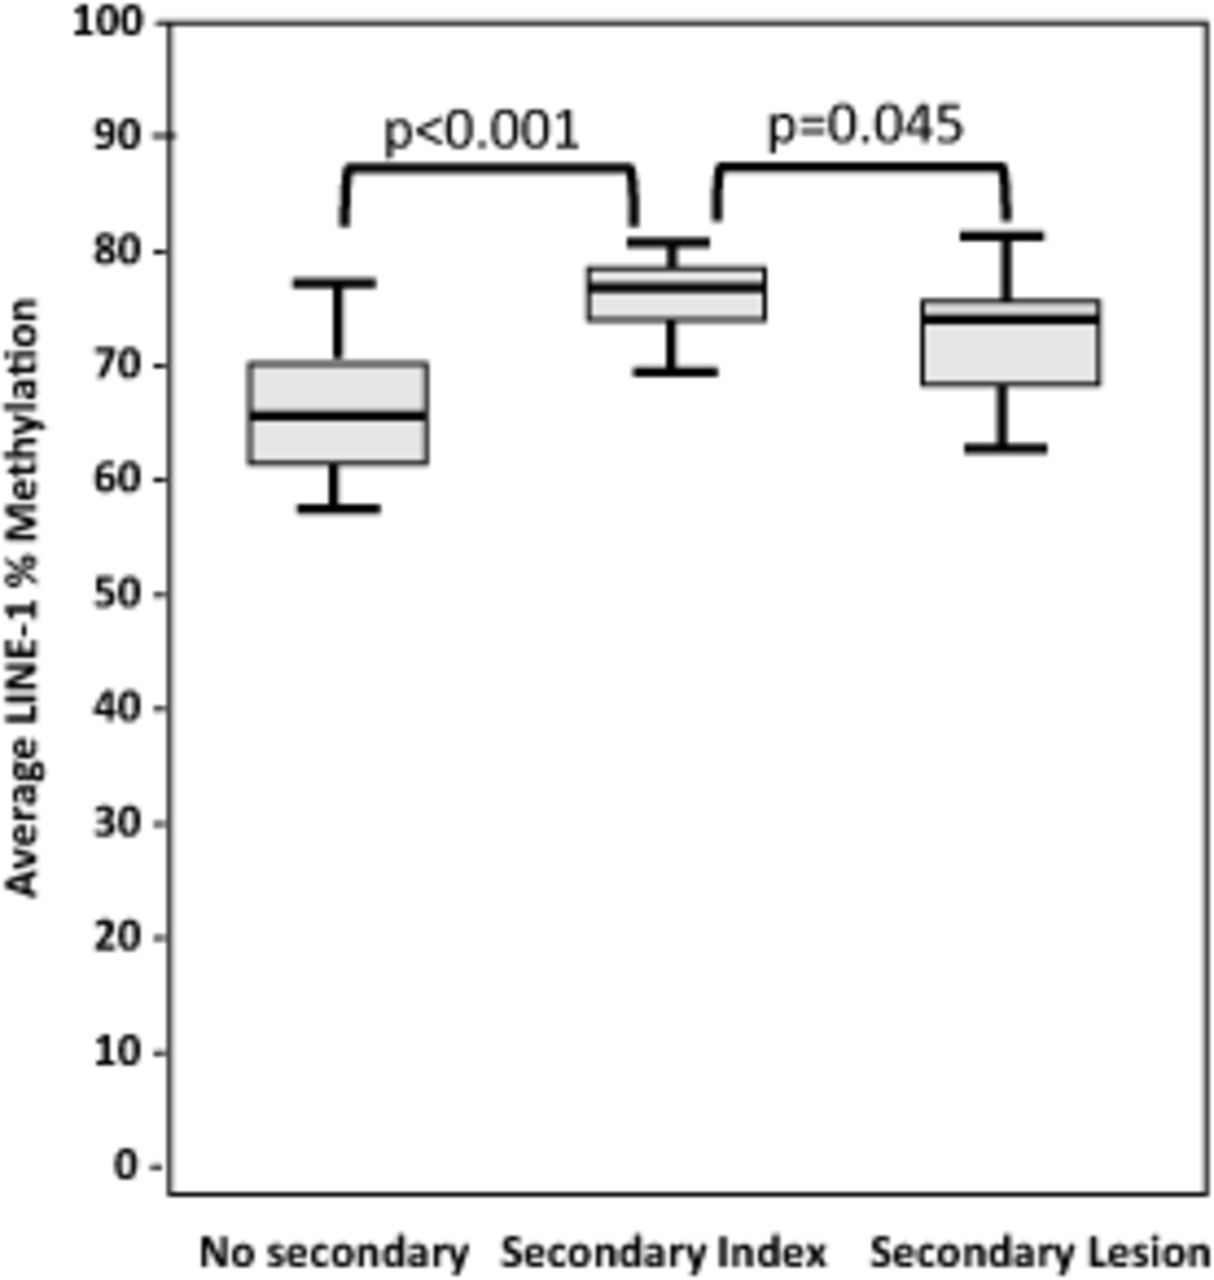
- Figure 1.
Median of LINE-1 methylation levels of each independent risk group (no secondary average = 64.8%, secondary index = 75.8%, secondary lesion = 68.9%). LINE-1 methylation levels were significantly lower in index polyps without (left) vs index lesion with (center) secondary lesions (P < .001). Paired-sample analysis of secondary index and secondary lesion samples displayed significant LINE-1 hypomethylation in the secondary lesion samples (z = −2.009, P = .045).
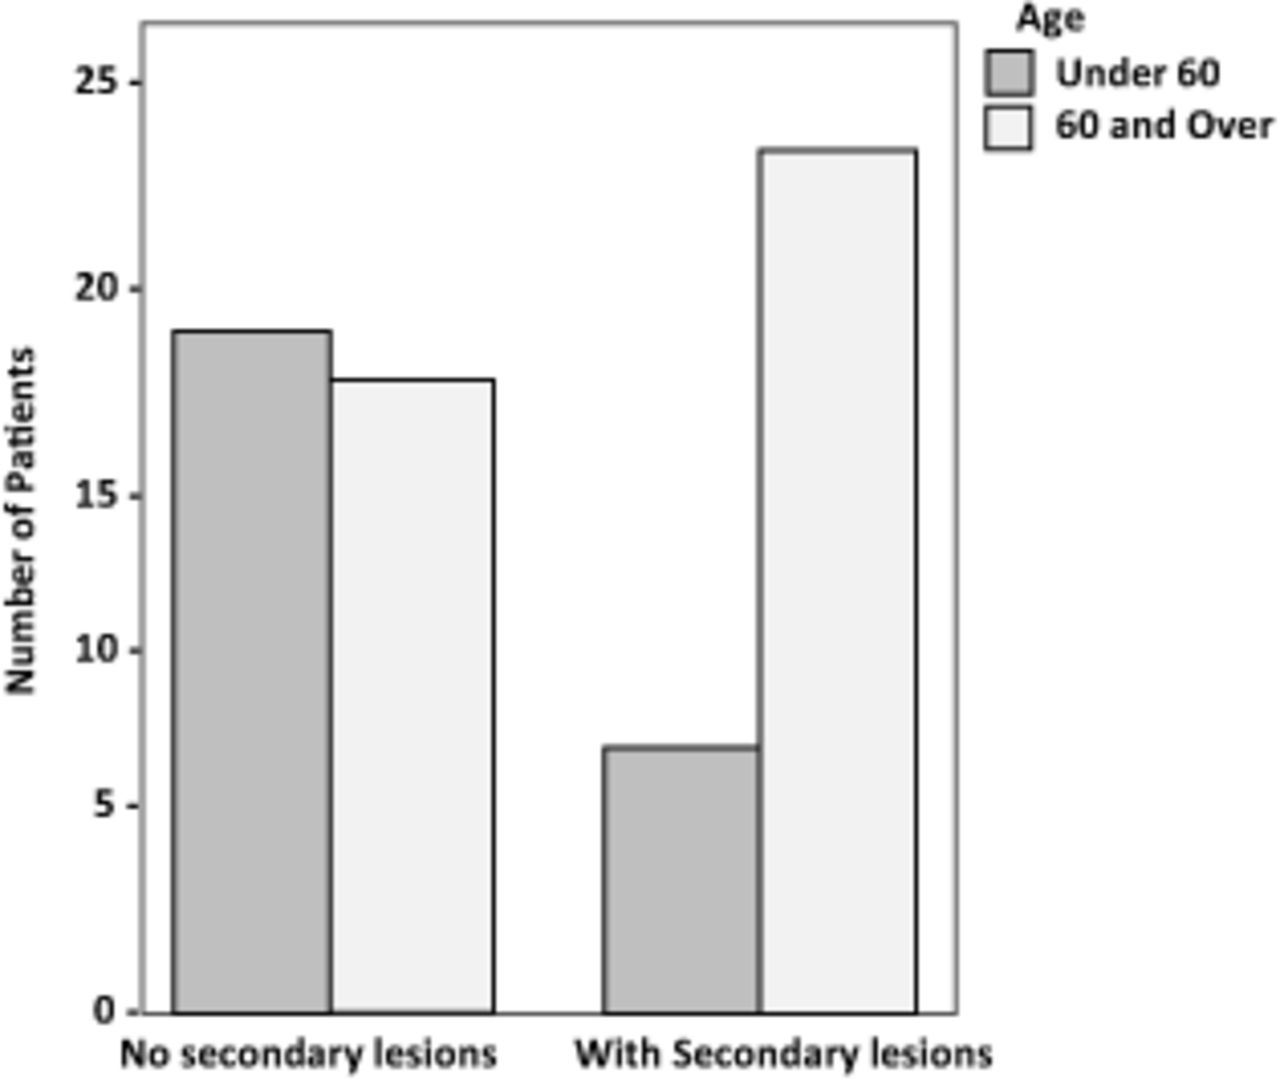
- Figure 2.
Total number of participants in each group (with or without secondary lesions) by age (<60 years, and 60 years and older). The group with secondary lesions contained a statistically older patient population (Chi-Square P = .019).
- Figure 3.
(A) Regression analysis of age vs LINE-1 methylation. (B) Methylation of LINE-1 with dichotomized age (Mann-Whitney U Test, P = 0.085). Under 60 median methylation = 55%, 60 and over median methylation = 62%.
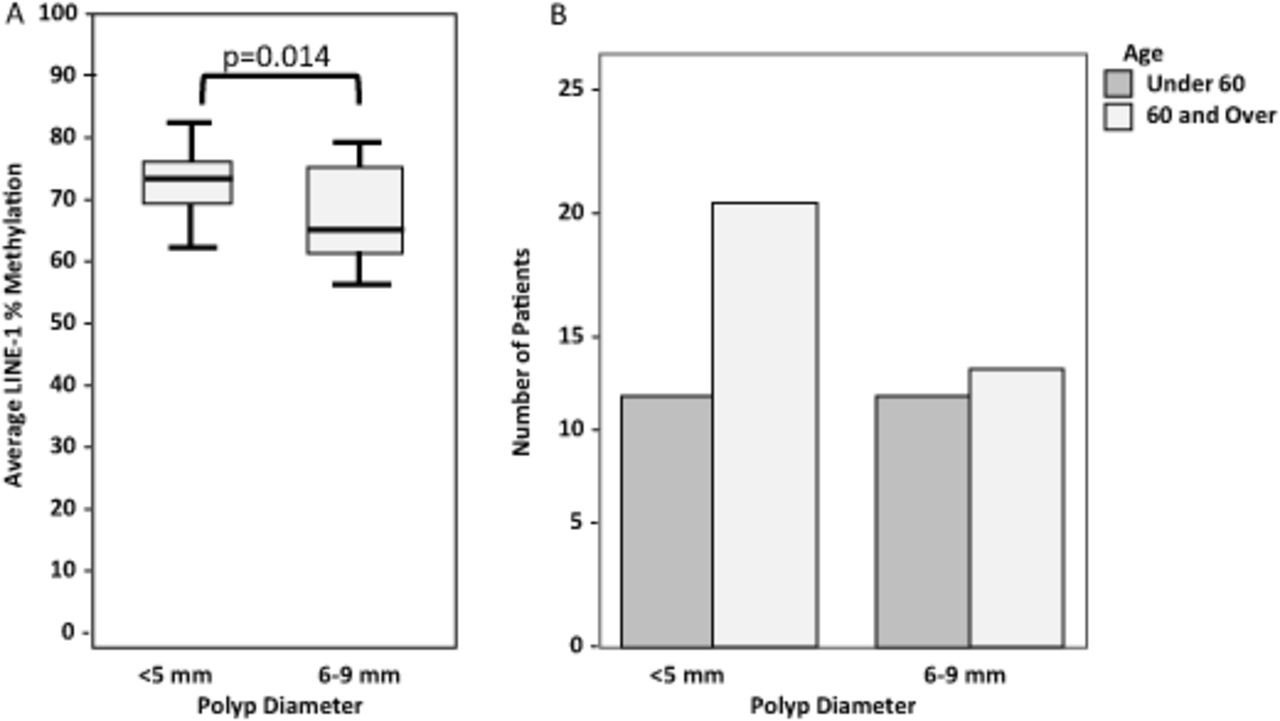
- Figure 4.
(A) Smaller polyps were found more frequently in the 60 and over group (Chi-Square P = 0.008). (B) Median LINE-1 promoter methylation compared to polyp size (P = 0.014). Under 5 mm: median methylation = 72%, 6 mm and over: median methylation = 67%.


Tables
Descriptor Total No Yes n = 65 n = 35 n = 30 Sex Male 37 21 16 Female 28 14 14 Race African American 28 14 14 Caucasian 27 13 14 Other 10 8 2 Smoking history Yes 42 12 11 No 23 23 19 Agea (range) <60 years (44–59) 25 18 7 ≥60 years (60–85) 40 17 23 Polyp location Distal 24 15 9 Proximal 38 18 20 Mixed 3 2 1 Polyp sizeb <5 mm 32 11 22 6–9 mm 24 18 6 Mixed 9 6 2
DescriptorNumber of
Cases n = 65LINE-1 CpG
Site 1LINE-1 CpG
Site 2LINE-1 CpG
Site 3LINE-1
AverageAge (range) <60 years (44–59) 25 92.8 55.4 55.9 67.6 ≥60 years (60–85) 40 93.5 59.1 60.6 71.1 P = .707 P = .149 P = .016 P = .105 Gender Female 37 93.8 57.9 57.9 69.8 Male 28 92.5 58.0 59.5 70.0 P = .489 P = .943 P = .422 P = .923 Race African American 28 94.6 59.8 59.7 71.4 Caucasian 27 92.8 57.8 59.5 70.0 Othera 10 89.2 51.0 54.4 64.9 P = .330 P = .322 P = .931 P = .451 Smoking history Yes 23 92.2 57.4 58.5 69.4 No 42 93.8 58.2 58.7 70.2 P = .563 P = .745 P = .963 P = .726 Polyp location Distal 24 91.4 56.5 57.6 68.5 Proximal 38 94.8 59.1 59.4 71.1 Mixedb 3 86.0 53.3 56.7 65.3 P = .064 P = .157 P = .400 P = .121 Polyp size ≤5 mm 32 94.3 59.6 60.3 71.4 6–9 mm 24 91.3 55.0 55.7 67.3 Mixedb 9 91.3 55.8 58.4 68.5 P = .127 P = .013 P = .020 P = .014 Metachronous tumors No 35 89.2 52.6 52.7 64.8 Yes 30 97.9 64.1 65.5 75.8 P < .001 P < .001 P < .001 P < .001


Jump to section
Related Articles
Cited By...
- No citing articles found.