


This article requires a subscription to view the full text. If you have a subscription you may use the login form below to view the article. Access to this article can also be purchased.
- Address for Correspondence: Shashi Mehta
, SHP-Rutgers University, mehtas1{at}shp.rutgers.edu
LEARNING OBJECTIVES
1. Identify the steps to design an evidence-based quality control (QC) system.
2. Set QC limits and frequency based on the sigma value of each assay.
3. Use the concept of total error to evaluate method performance.
ABSTRACT
Standard statistical quality control (QC) has been around since its introduction in 1950 by Levey and Jennings. Today, while most laboratories use standard statistical QC processes, with or without Westgard multi-rules to evaluate quality, few incorporate performance standards in their QC systems. With performance standards, the quality level of each test is determined on a sigma scale. This guides the selection of optimal QC frequency and rules to monitor the analytical system. QC rules are selected based on the sigma score and are specific to each test. While a single rule (13s) is sufficient to efficiently monitor tests with sigma quality at or above 6, a more stringent rule (13s/22s/R4s/41s) is required for those performing at four sigma. The comparison of analytical total error (TE) to the total error allowable (TEa) helps ensure that the system is operating within the defined quality specifications; therefore, accurate patient results are produced.
- ΔSEc - critical systematic error
- CAP - College of American Pathologists
- CLIA - Clinical Laboratory Improvement Amendments
- DPM - defects per million
- EQA - external quality assurance
- IQC - internal quality control
- PT - proficiency testing
- QC - quality control
- RCPA - Royal College of Pathologists of Australasia
- SD - standard deviation
- TE - total error
- TEa - total error allowable
INTRODUCTION
Laboratory testing plays a tremendous role in the diagnosis, treatment, monitoring, and management of patients’ conditions. The accuracy of laboratory results is critical for the delivery of quality healthcare.1 Laboratories ensure the accuracy of their test results through the implementation of an internal quality control (IQC) system and through the participation of external quality assurance (EQA) programs. A properly designed quality control (QC) system should effectively detect errors in the analytical system while minimizing false rejection.2,3
The standard QC practice in most laboratories is a statistical QC system in which the control limits are set at ±2 standard deviations (SDs) from the mean.3 With the improvement of technology and methodology over the years, analytical systems have shown better accuracy and precision, and small changes in analyzers’ performance may not be easily identifiable by standard QC processes.2,3 In order to optimize QC processes, clinical laboratories need to implement evidence-based QC. Evidence-based QC requires quality goals against which the analytical system performance will be compared.3,4 Quality goals, also known as performance standards, are the acceptable limits for both random and systematic analytical errors and are used to determine if analytical methods are producing clinically acceptable results.4,5 Performance standards are expressed as total error allowable (TEa). With the incorporation of quality goals, not only can standard QC systems detect an error in the operating system but they can also safely determine if the error will lead to unacceptable patient results.3
ANALYTICAL SYSTEMS
The laboratory testing process can be divided into three phases (pre-analytical, analytical, and post-analytical) and errors can occur at any stage.1 Errors associated with analytical systems are monitored through the implementation of an IQC system and are the main focus of this paper. Laboratories also participate in EQA or proficiency testing (PT) programs to ensure that they are meeting the quality requirements set by regulatory bodies.
Analytical systems are subject to systematic and random errors. Bias is an estimate of systematic error and SD is the measure of a random error. When a stable QC material is measured for a period of time, it creates a population of data points that, when plotted, will display a normal or Gaussian distribution. With a single data population, it can be predicted that approximately 68% of the data, or area under the curve, will fall within ±1 SD of the mean, 95% between ±2 SDs, and 99.7% within ±3 SDs. Gaussian statistics and predictions are the key to understanding statistical QC in clinical laboratory settings.3⇓-5
HISTORY OF QC
QC has been utilized in medical laboratories for several decades and has evolved over the years with advances in technology. Before the introduction of statistical QC by Levey and Jennings, laboratory tests were performed manually in batches where QC samples were run along with patients’ samples. Statistical QC arose with the introduction of the Levey-Jennings chart in 1950, and QC samples were run in duplicate with the range of acceptability set at ±3 SDs from the statistical mean.4,5
With the introduction of automation in 1960, QC samples were reduced to a single measurement and the QC limits were set at ±2 SDs.4,6 Statistical QC became the basis of QC for quantitative tests in clinical laboratories.6 This QC acceptability criteria worked well with the single test auto-analyzer until multichannel analyzers made their way into clinical laboratories. There is a 5% false rejection rate when the ±2 SDs rule is used for one analyte. For two levels of control, the probability of false rejection increases to 9.5%.6
With multitest systems, several different tests can be performed simultaneously on one analyzer. With simultaneous measurements, the rate of false rejection increases because of a multiplier effect.6 In order to maximize error detection and minimize the false rejection rate, Dr. Westgard developed a set of rules, known as Westgard rules,7 in which QC limits were set at ±3 SDs and ±2 SDs violation was used as a warning.4,6
Today, most laboratories still use the standard statistical QC with or without Westgard multi-rules. Statistical QC design is based on the mean and SD mostly calculated from 20 QC data points when a new QC material is started.3 This standard QC system sets limits at ±2 SDs from the mean to assess quality.2,3 The question arises: to what level of quality are we controlling?
PERFORMANCE STANDARDS
Expressed as TEa, quality goals, also known as performance standards, are the acceptable limits for both random and systematic errors and are used to determine if analytical methods are producing clinically acceptable results.3⇓-5 While selecting quality goals, laboratories should ensure that they are based on scientific evidence and are attainable by the analytical system.
Various quality requirements have been identified over the years, leading to several sources of performance standards. In 1999, a conference was held in Stockholm to reach a consensus on how to set quality goals in laboratory medicine. The conference, sponsored by the International Union of Pure and Applied Chemistry (IUPAC), the International Federation of Clinical Chemistry and Laboratory Medicine (IFCC), and the World Health Organization (WHO), included participants from 27 countries.7 The consensus statement laid out the hierarchy of models from the highest to the lowest. Five models were described and based on the following:
1. Clinical requirements or clinical outcomes
2. Biological variation within and between individuals
3. Professional recommendations such as those seen in professional expert publications
4. Quality specifications set by regulatory bodies (eg, the Clinical Laboratory Improvement Amendments [CLIA]) and the PT organizer (eg, College of American Pathologists [CAP])
5. State of the art performance
These five models were later reduced to three after the Stockholm consensus was revised in 2014 in Milan. The first and second models were kept intact, whereas the remaining three were combined under the umbrella of state-of-the-art performance.8
EVIDENCE-BASED APPROACH TO QC
Unlike traditional QC design, evidence-based QC requires the laboratory to set quality goals for each analyte tested. Expressed as TEa, quality goals or performance standards are the acceptable limits for both random and systematic errors and are used to determine if analytical methods are producing clinically acceptable results.3
Method performance is assessed by evaluating the analytical total error (TE), which is the combined effect of bias and imprecision.3,9 By comparing the TE to TEa, the laboratory can determine if their analytical system is operating within their defined quality specifications. In this model of design, QC limits are determined based on the analytical system capability in terms of the sigma metric (σ). Another useful quality indicator of method performance is critical systematic error (ΔSEc), which is the number of SDs that the mean can shift before 5% of results fall outside a defined quality specification (TEa).3,4,10
TRUE/TARGET VALUE
The analyte true value, used to monitor a method’s accuracy, is the best available estimate of the analyte value and is preferably based on a peer group method mean.11 True value should not be confused with the laboratory observed mean. If a laboratory does not participate in an interlaboratory comparison program, the manufacturer’s target value may be used. When those two options are not available, the laboratory’s own historical data may be used.3,4
TOTAL ERROR
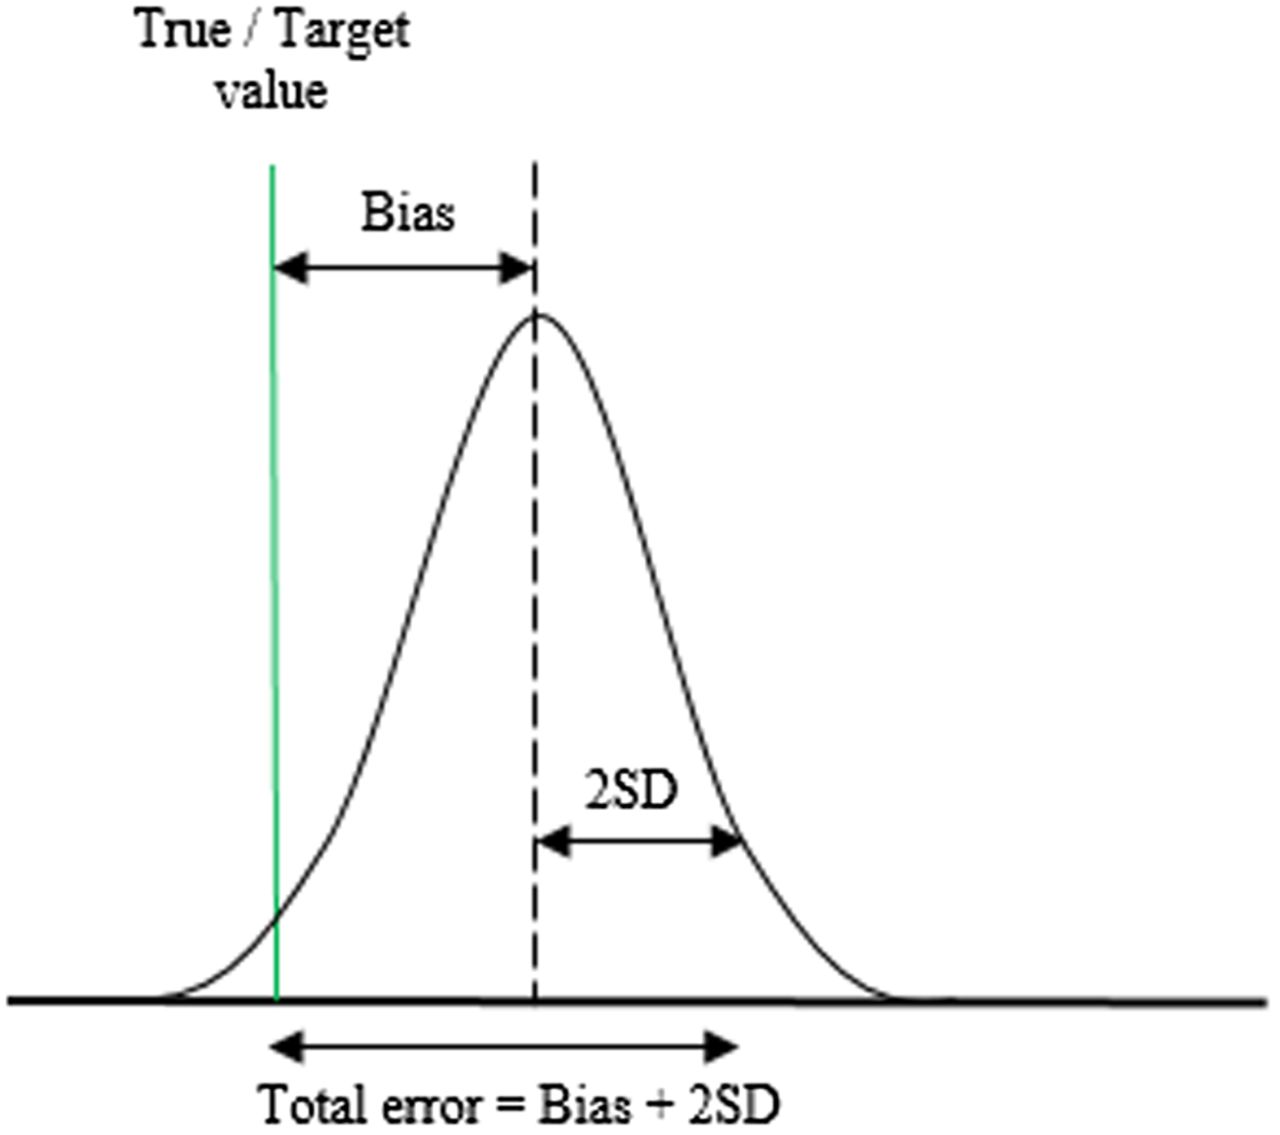
Once the true value is determined, the analytical mean bias can be calculated. The bias represents the systematic error and is the measure of the difference between the laboratory observed mean and the true value. Random error, also known as imprecision, is expressed as SD and is the measure of dispersion around the mean. The total variation of a test result from the true value combines the effects of bias and random error and is defined as TE.3,4 Figure 1 shows the visual representation of TE.9,18

Illustration of the concept of total error, which is the combination of systematic error (bias) and random error (2 SD).
The following formula is used to calculate the analytical TE: 
Method performance is evaluated by comparing TE to the TEa.
TOTAL ERROR ALLOWABLE
TEa is the tolerance limit, the maximum acceptable variation from the true value of an assay.3,4 As pointed out earlier, there are several sources of TEa limits. In the United States, CLIA sets limits for acceptable method performance. For example, the CLIA limit for chloride is the target value ±5%. The TEa in this case is ±5% of the true value of the analytes.3,4 This criterion is also used by CAP. Regulatory agencies from different countries may have different limits. In Australia, the Royal College of Pathologists of Australasia (RCPA) sets the limit for acceptable analytical performance for chloride at 3 mmol/L when levels are below or equal to 100 mmol/L and at ±3% if levels are above 100 mmol/L.13 Chloride’s quality specification is more stringent when based on biological variation and is set at ±1.5% for desirable performance.14
SIGMA METRIC
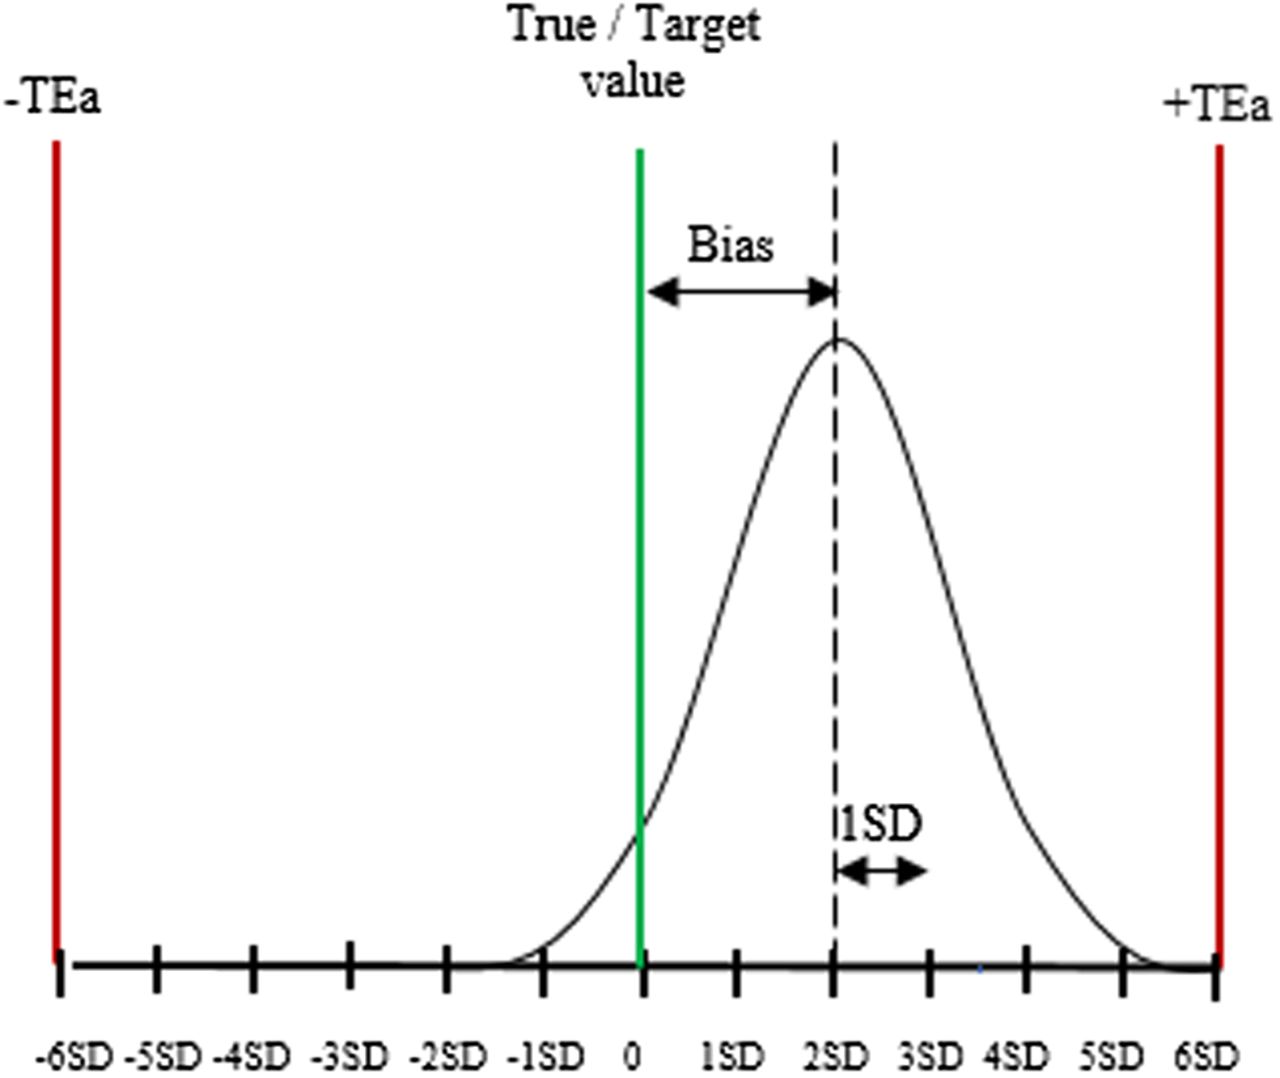
By definition, the sigma metric is the number of SDs that the closest tolerance limit is from the mean of the assay.3,4 The concept of six sigma is widespread in industry quality management and requires defined tolerance limits in order to evaluate quality in terms of a sigma metric.3,4,15⇓-17 In the industry, a sigma value ranges from one to six and relates to the number of defects per million (DPM). A system with one sigma produces 697,700 DPM, whereas a six-sigma process generates 3.4 DPM. Six sigma is regarded as world-class quality, and three sigma (66,807 DPM) is the minimum recommended for routine production.4,11,12 In the laboratory, total allowable error (TEa) represents the tolerance limit and is used to calculate an assay performance on a sigma scale (Figure 2).18 The sigma metric is calculated as follows: Sigma metric (σ) = (TEa − Bias)/SD

Sigma metric. The graph shows how six-sigma tolerance limits apply to QC in a clinical laboratory. The sigma value of this essay is four, as the mean is at 4 SD from the upper tolerance limit.
Assuming a laboratory test has a bias equal to 3, an SD of 2, and the TEa set at 13, the sigma metric for the assay is (13 − 3)/2 = 5. If the same test has a larger bias equal to 4 and an SD of 3, the sigma value will be (13 − 4)/3 = 3. There is a positive correlation between the sigma score and a test performance. The higher the sigma metric, the better the test performance.
SETTING RULES BASED ON SIGMA VALUE
Standard QC systems use the same QC rules (mostly ±2 SD) for all analytes regardless of the level of performance, whereas the rules in evidence-based QC systems are based on each analyte’s performance expressed in the sigma metric.10 Westgard Sigma rules allow laboratories to select QC limits and the number of control measurements needed to achieve optimal error detection (≥90%), and keep false rejection below 5%.6,10,19,20
Table 1 shows QC limits and frequency based on the assay’s capability. Highly capable tests with sigma scores at or above six do not require stringent QC rules, as they can be controlled easily and efficiently.4,9 Two levels of control run once every 24 hours with limits set at 13s are enough to control the quality of the results. The probability of false rejection is 0%, meaning any error detected is significant and should be addressed. At five sigma, the 13s/22s/R4s QC rule is needed to bring about error detection above 90% and false rejection below 5%.5,20
QC rules based on sigma metric for two control measurements per run
Tests performing at four sigma require additional rules (13s/22s/R4s/41s) and increased QC frequency (two levels of control run twice a day or four levels run once a day).
The maximum QC rule (13s/22s/R4s/41s/8x) and higher QC frequency are recommended for performance below four sigma. The appropriate QC frequency is four times in 24 hours when two levels of control are used, and twice a day when four levels of control are measured per run.5,20
CRITICAL SYSTEMATIC ERROR
ΔSEc is used to monitor method performance over time. As defined previously, ΔSEc measures how far the mean can shift before 5% of the results exceed a TEa limit.3,4 ΔSEc is calculated as follows: 
The figure 1.65 represents the z-score associated with 5% risk of producing erroneous results. It corresponds to 95% confidence limits.3,4 For example, a test method with a quality level at six sigma is associated with a ΔSEc of 4.35 (6 − 1.65 = 4.35); therefore, the mean can shift 4.35 SD before 5% of results exceed TEa. On the other hand, a test method with 1.65 sigma value is already producing 5% erroneous results as ΔSEc is 0 (1.65 − 1.65 = 0). The probability of producing clinically misleading patient results or unacceptable proficiency tests will exceed 5% with any increase in bias or imprecision.
CONCLUSION
Even though multiple analytes are run on the same analyzer platform, they do not always perform at the same level. Quality varies between tests and from one analytical system to another; therefore, it may not be appropriate to set the same QC rules for different analytes.
Setting quality goals allows laboratories to design a more efficient QC system and select error detection limits specific to the quality level (sigma score) of each analyte. Such systems can be objectively monitored for improvement. The calculated monthly ΔSEc tracks the performance of the analytical system relative to the quality goals (TEa) set. The ΔSEc decreases as the TE produced moves closer to the error limits set (TEa). A ΔSEc of 0 indicates that the probability of producing clinically misleading patient results or unacceptable proficiency tests is greater than 5%.7
- Received April 1, 2018.
- Accepted April 5, 2018.
American Society for Clinical Laboratory Science


Jump to section
Related Articles
Cited By...
- No citing articles found.
More in this TOC Section
Similar Articles
Keywords
- ΔSEc - critical systematic error
- CAP - College of American Pathologists
- CLIA - Clinical Laboratory Improvement Amendments
- DPM - defects per million
- EQA - external quality assurance
- IQC - internal quality control
- PT - proficiency testing
- QC - quality control
- RCPA - Royal College of Pathologists of Australasia
- SD - standard deviation
- TE - total error
- TEa - total error allowable
- performance standards
- quality goals
- evidence-based quality control
- critical systematic error