


Article Figures & Data
Figures
- Figure 1.
Seven-cell morphology parameters. (A) Box 1 indicates chromatin pattern (lacey). Box 2 indicates cellular shape (round). (B) Box 3 indicates granulation type (eosinophilic). Box 4 indicates granulation amount (many). Box 5 indicates nuclear shape (bilobed). (C) Box 6 indicates nucleoli presence (one). Box 7 indicates cytoplasm color (violet).
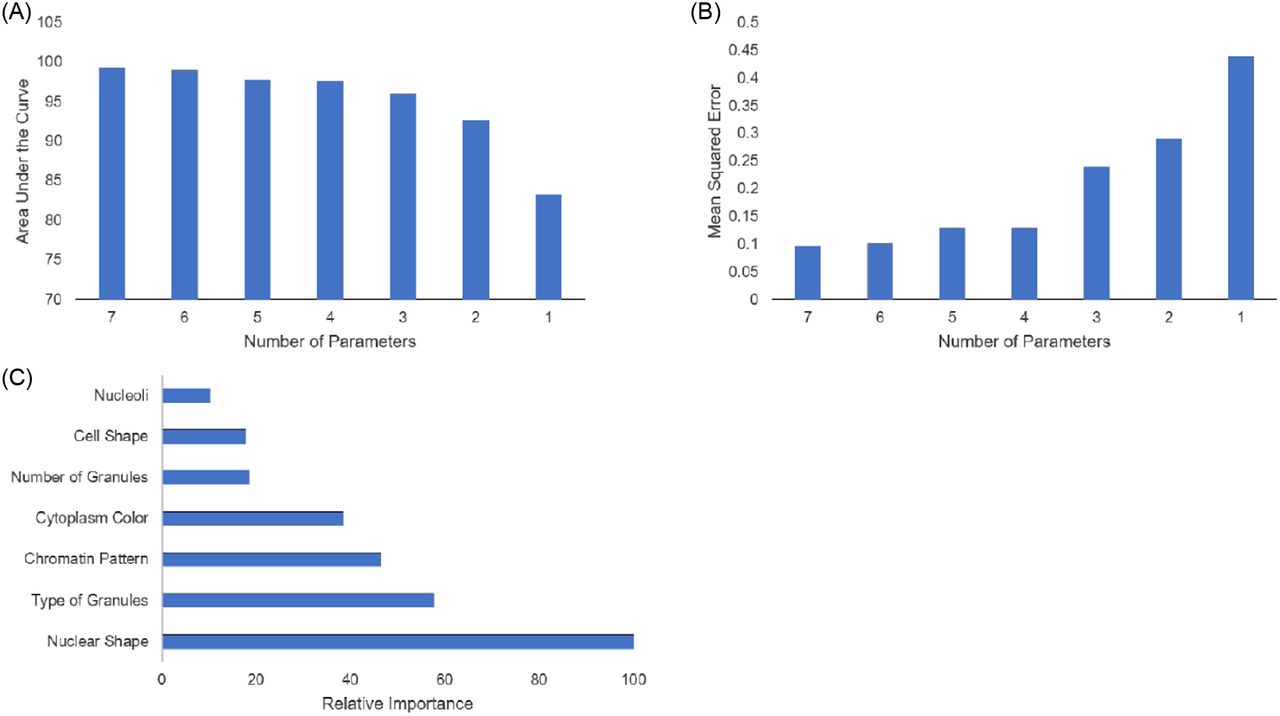
- Figure 2.
Variable optimization and importance. (A) Decreasing the number variables, starting with the least important variable decreased the overall AUC of the model. (B) Decreasing the number of variables used by the model also increased the overall MSE of the model. (C) The relative importance of each variable in reducing the MSE of the model’s performance is displayed. The most important variable is scaled to 100% important.
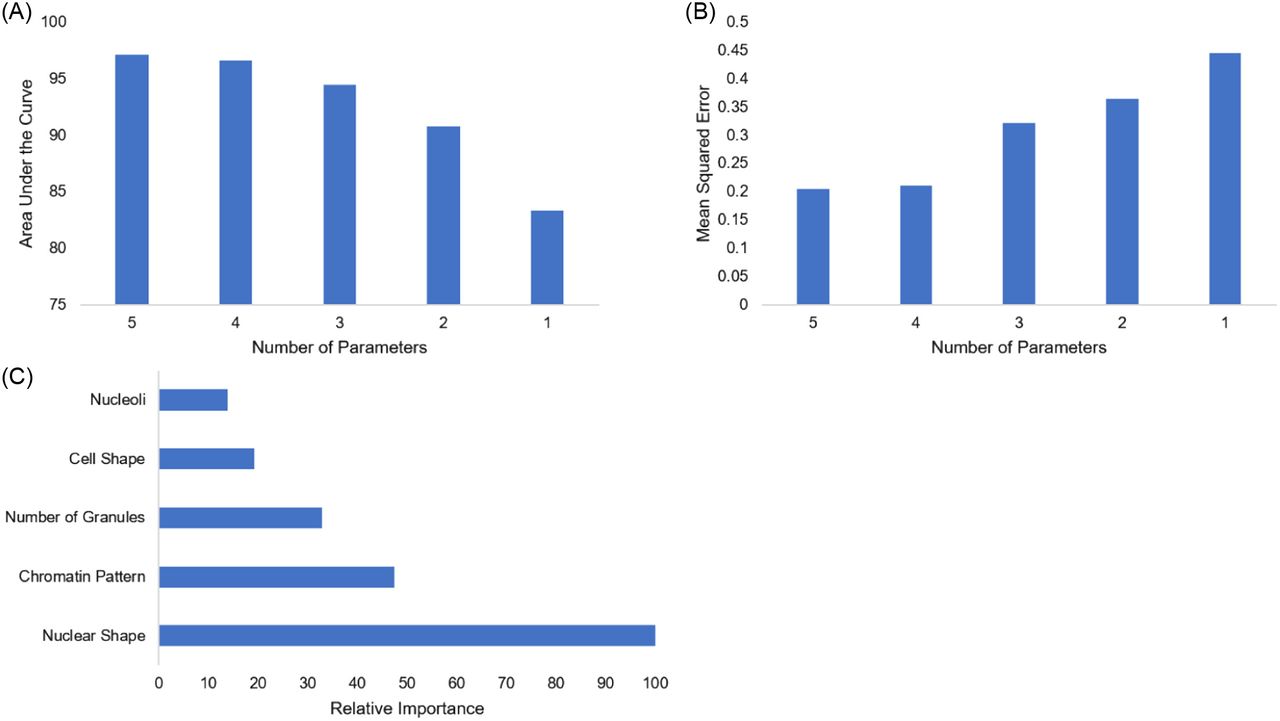
- Figure 3.
Variable optimization and importance without color. (A) The impact of decreasing the number of variables, starting with the least important variable on AUC. (B) The impact of decreasing the number of variables used by the model on MSE. (C) The relative importance of each variable in reducing the MSE of the model’s performance is displayed. The most important variable is scaled to 100% important.


Tables
Band Basophil Blast Eosinophil Lymphocyte Metamyelocyte Monocyte Myelocyte Segmented
NeutrophilNRBC Prolymphocyte Promonocyte Promyelocyte Reactive
LymphocyteSmudge
CellAccuracy 0.999 1 0.974 1 0.960 0.999 0.971 0.999 0.998 0.998 0.981 0.981 0.982 0.967 0.999 Misclassification rate 0.001 0 0.026 0 0.039 0.001 0.028 0.001 0.002 0.002 0.018 0.018 0.017 0.032 0.001 Precision 0.991 1 0.782 1 0.873 0.983 0.858 0.988 1 1 0.62 0.404 0.975 0.737 0.985 Sensitivity 1.000 1 0.767 1 0.817 1 0.796 1 0.988 0.907 0.689 0.913 0.726 0.871 1 Specificity 0.999 1 0.987 1 0.982 0.999 0.988 0.999 1 1 0.982 0.982 0.999 0.975 0.999 The model’s performance for accuracy, precision, sensitivity, and specificity for each cell type from the test data are presented.


Jump to section
Related Articles
Cited By...
- No citing articles found.