

Article Figures & Data
Figures
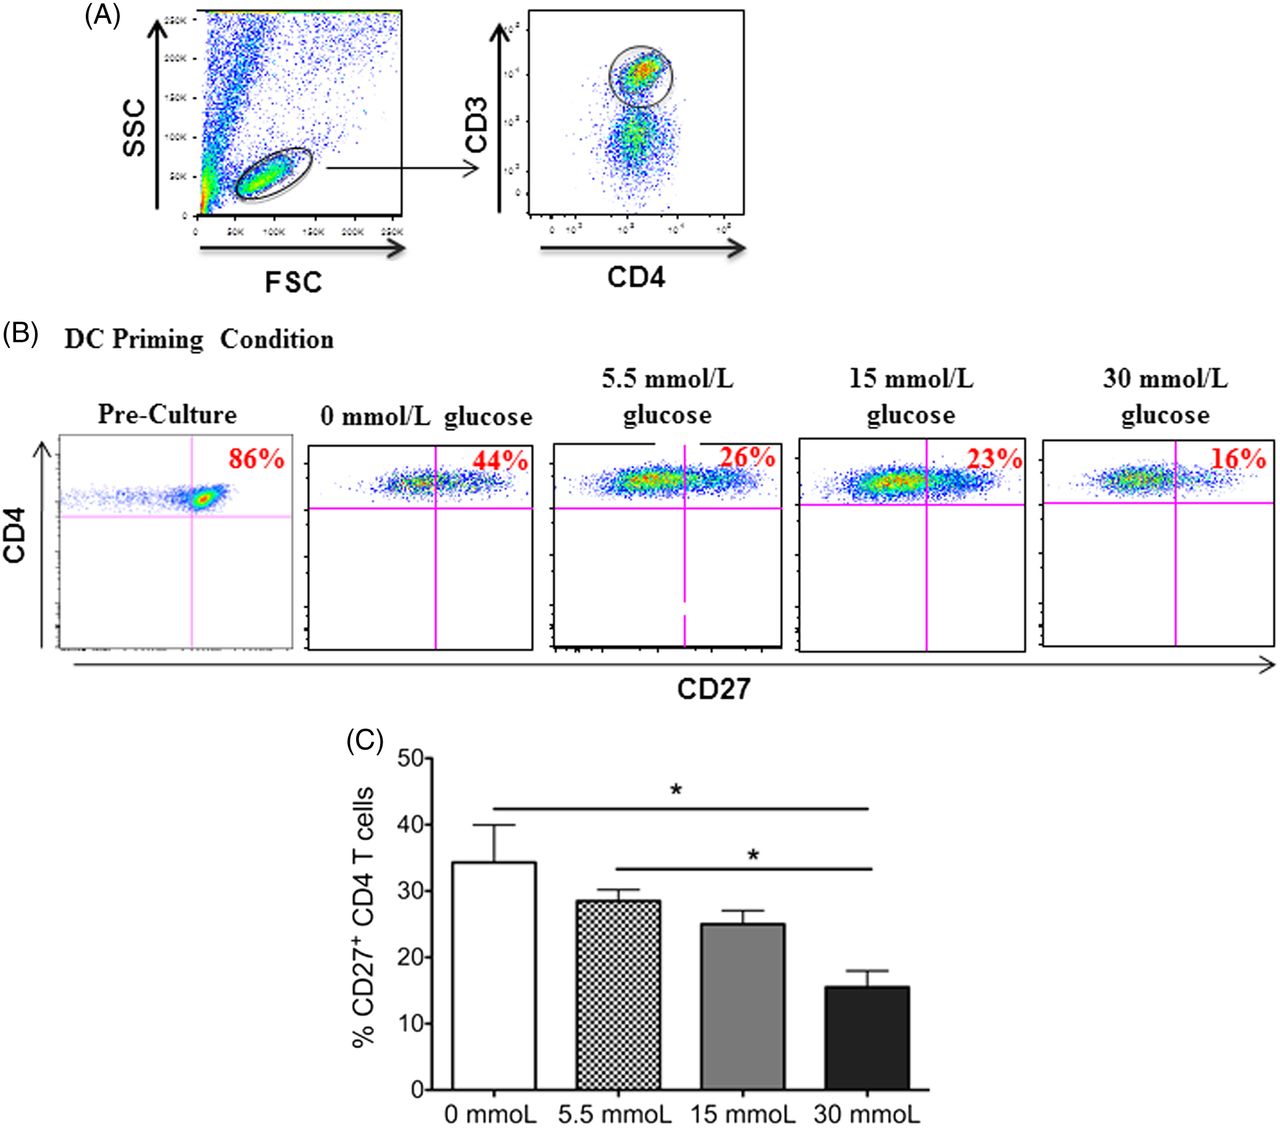
- Figure 1.
CD27 expression on CD3+CD4+ T cells in coculture with dendritic cells primed in increasing concentrations of glucose. Peripheral blood–derived CD3+CD4 T cells were cocultured with autologous dendritic cells primed in varying concentrations of glucose. After 7 days in culture, the expression of CD27 on the surface of the T cells was analyzed via flow cytometry. In this figure, (A) gating scheme of CD3+CD4+ T cells gated from total lymphocytes in cell culture, (B) representative dot plots of this CD27 expression, and (C) bar graphs are shown. Data represent 2 independent experiments with 3–6 wells per culture condition. *P ≦ 0.05.
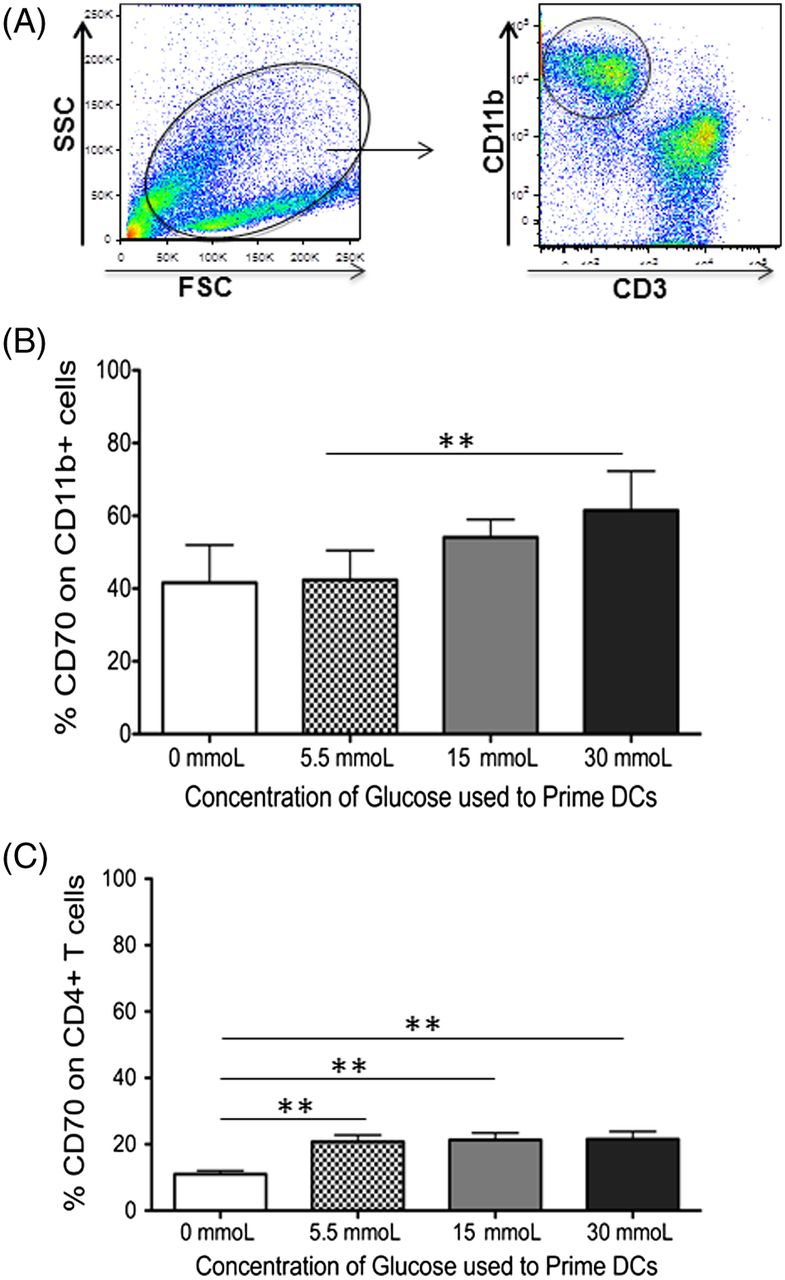
- Figure 2.
PBMC-derived dendritic cells increase their CD70 expression when primed in increasing concentrations of glucose. Peripheral blood–derived human CD11b+ cells were primed in varying concentrations of glucose. Autologous CD3+ T cells were added at a 1:10 DC:T-cell ratio 24 hours after the addition of glucose. After 7 days in coculture, expression of the costimulatory molecule CD70 on CD11b+ dendritic cells or CD3+CD4 T cells was determined using flow cytometry. This figure includes (A) gating scheme of CD11b+ DCs gated from total cells in cell culture, (B) bar graphs showing the expression of CD70 on CD11b+ DCs, and (C) bar graphs showing the expression of CD70 on CD3+CD4+ T cells. Data represent 4 independent experiments with 3–6 wells per culture condition. *P ≦ 0.05; **P ≦ 0.01.
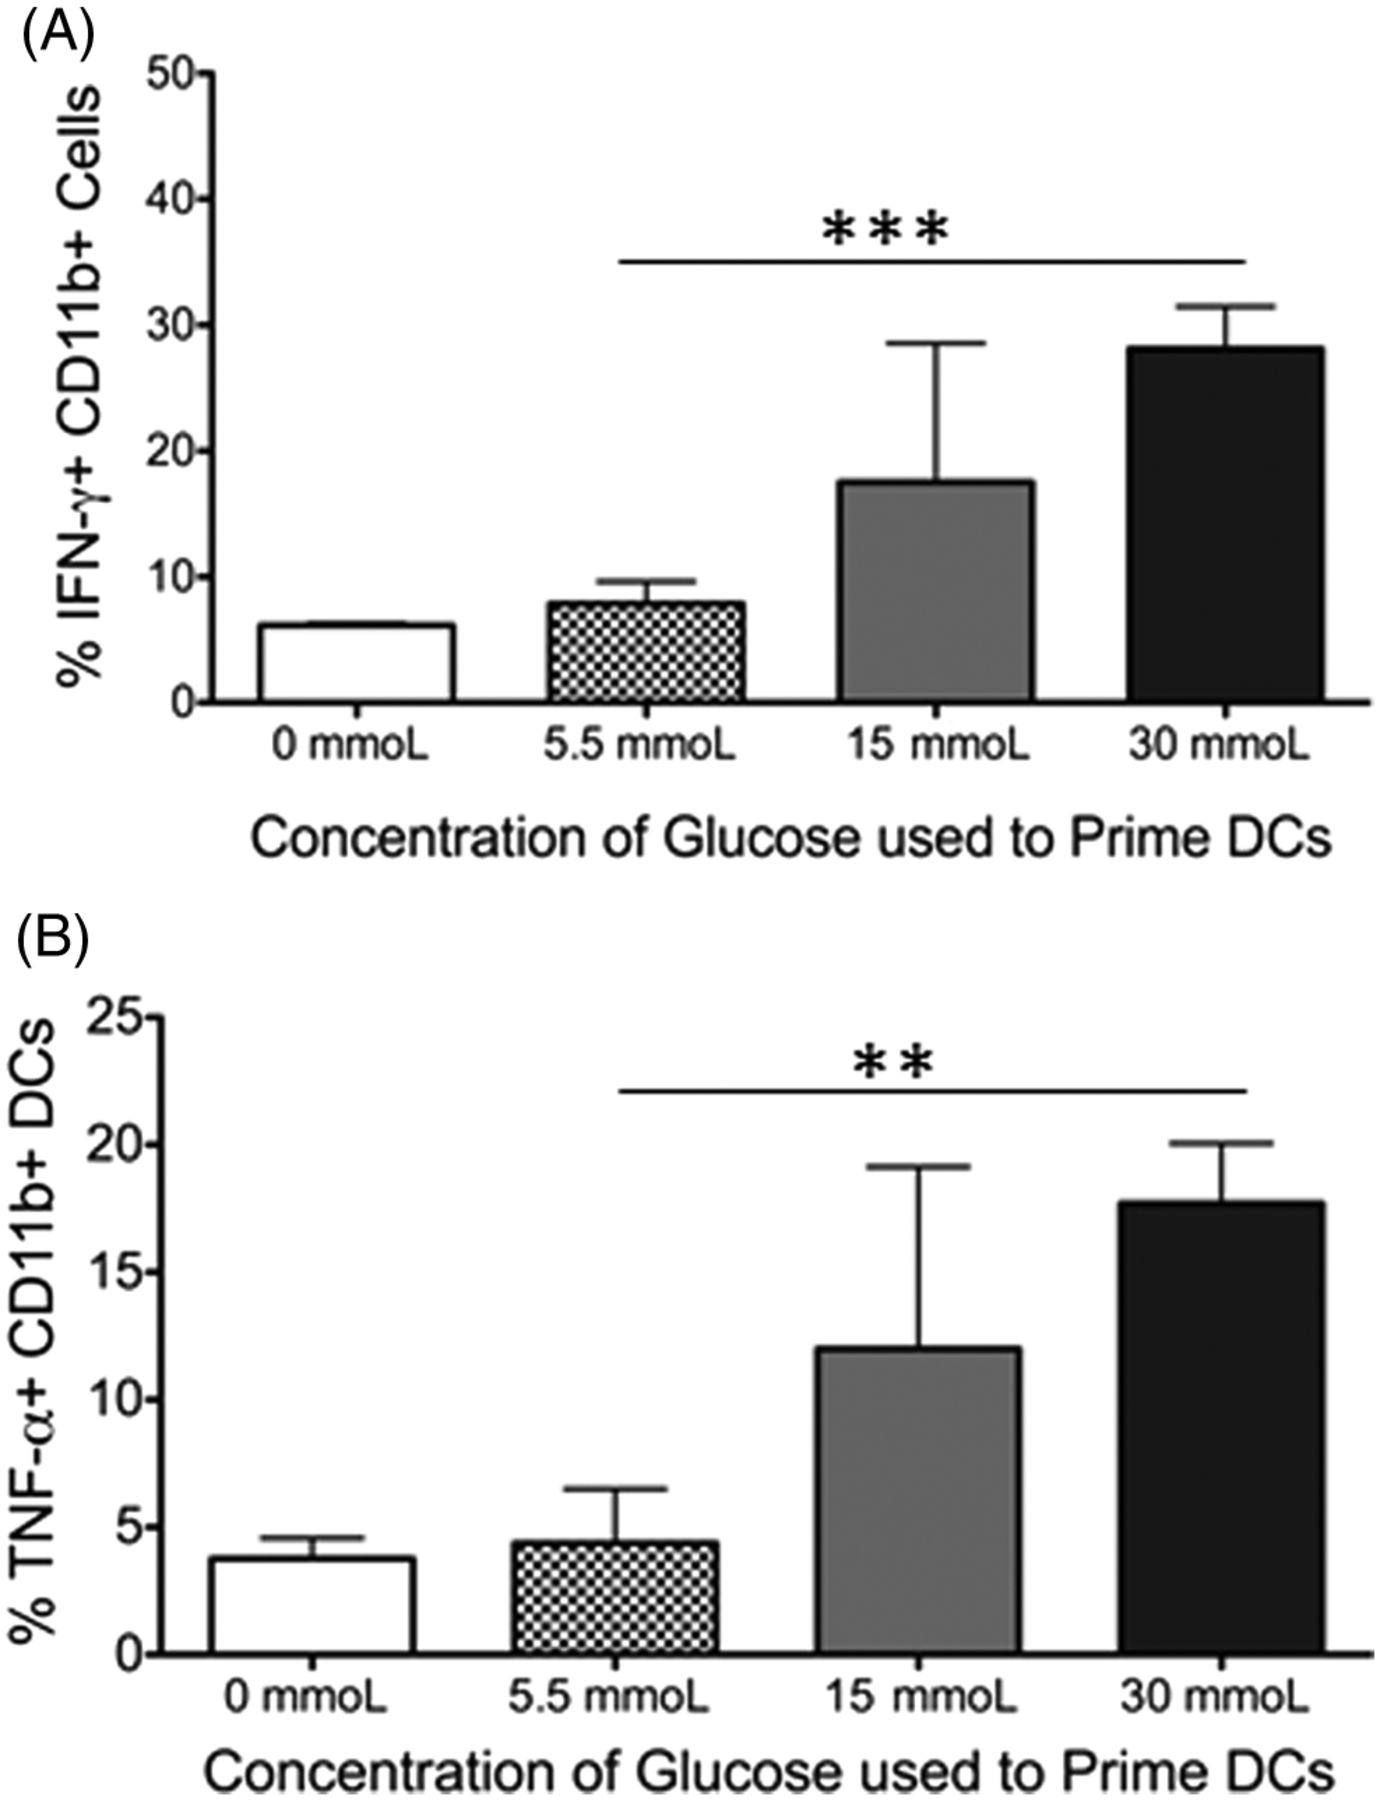
- Figure 3.
PBMC-derived dendritic cells but not T cells secrete proinflammatory cytokines after 7 days of coculture in hyperglycemic conditions. Peripheral blood–derived human CD11b+ cells were primed in varying concentrations of glucose. After 7 days in coculture with autologous CD3+ T cells, the production of the inflammatory cytokines was analyzed from both cell types via intracellular staining. The figure shows (A) bar graphs showing the production of IFN-γ and (B) TNF-α from CD11b+ DCs. Data represent 2 independent experiments with 3–6 wells per culture condition. Unstained and isotype controls were used as negative gates for cytokine expression. **P ≦ 0.01; ***P ≦ 0.0001.


Jump to section
Related Articles
Cited By...
- No citing articles found.
More in this TOC Section
Similar Articles
Keywords
- ADA - American Diabetes Association
- APC - antigen-presenting cell
- DC - direct current
- GM-CSF - granulocyte-macrophage colony-stimulating factor
- IFN - interferon
- IL - interleukin
- MACS - magnetic-activated cell sorting
- NK - natural killer
- PBMC - peripheral blood mononuclear cell
- PBS - phosphate-buffered saline
- TNF-α - tumor necrosis factor α
- TNFR - tumor necrosis factor receptor
- type 2 diabetes mellitus
- CD4-positive T lymphocytes
- inflammation
- hyperglycemia
- prediabetic state
- dendritic cell